Neal Dunn’s net worth over time
Swipe the chart to see every year →
His 2017 report merges a commercial strip-mall mortgage with a home-equity line into a single unreadable row, so that year is left out rather than guessed. His first report in the online database covers 2015, before he took office in 2017, so the chart starts before his first day in office. Every bar is one official report, added up the same way. Nothing is filled in between reports. Tap or hover a bar for details.
See every year as a table
| Year | Net worth range | Midpoint | Source |
| Cand. 2015 | $2.62M to $10.9M | $6.78M | Candidate report, filed November 23, 2015 |
| 2016 | $3.42M to $12.6M | $7.99M | 2016 report (new member), filed May 15, 2017 |
| 2018 | $4.87M to $14.2M | $9.53M | 2018 annual report, filed August 12, 2019 |
| 2019 | $4.92M to $12.2M | $8.54M | 2019 annual report, filed August 13, 2020 |
| 2020 | $4.01M to $11.4M | $7.71M | 2020 annual report, filed August 12, 2021 |
| 2021 | $4.56M to $12.8M | $8.66M | 2021 annual report, filed August 13, 2022 |
| 2022 | $1.82M to $6.99M | $4.41M | 2022 annual report, filed August 13, 2023 |
| 2023 | $2.65M to $6.74M | $4.7M | Amendment to 2023 annual report, filed August 13, 2026 |
| 2024 | $3.55M to $7.91M | $5.73M | 2024 annual report, filed August 13, 2025 |
| 2025 | $4.15M to $9.34M | $6.74M | 2025 annual report, filed August 13, 2026 |
Since taking office
Compares the candidate report from 2015, filed before taking office with the 2025 report, using the same method for both. Changes can come from a spouse’s assets, market moves, property values, new debts or how filers choose bands, and the forms do not say which. We do not guess.
What the latest report lists
| IRA #3: Invesco QQQ Trust, Series 1 (QQQ) | $500K–$1M |
| IRA #3: Apple Inc. – Common Stock (AAPL) | $250K–$500K |
| IRA #3: iShares Core S&P 500 ETF (IVV) | $250K–$500K |
| IRA #3: iShares U.S. Aerospace & Defense ETF (ITA) | $250K–$500K |
| Debts | none reported |
From the 2025 report filed August 13, 2026. Highlights only. The full report is linked in the sources below.
Where the money comes from
Main sources named in the disclosures and the reporting we cite. The forms don’t split the total into exact amounts, so we don’t show percentages.
Neal Dunn reported household assets minus debts of $4.15M to $9.34M, a midpoint of about $6.74M, on his latest financial disclosure (2025 annual report, filed August 13, 2026).
Neal Dunn has represented Florida's 2nd congressional district since 2017. He is a surgeon and a member of the Republican Party. The district covers much of the Florida Panhandle, including Panama City.
He served in the United States Army for eleven years and reached the rank of major before practicing medicine. He was first elected to Congress in 2016 and announced in January 2026 that he would not seek reelection. His 2017 report merges a commercial strip-mall mortgage with a home-equity line in a single unreadable row, so that year is left out rather than guessed.
What his 2025 disclosure shows
The report he filed on August 13, 2026 covers 2025. It lists 74 assets with a value, adding up to $4.2 million to $9.3 million. The largest are IRA #3: Invesco QQQ Trust, Series 1 (QQQ) ($500K–$1M); IRA #3: Apple Inc. – Common Stock (AAPL) ($250K–$500K) and IRA #3: iShares Core S&P 500 ETF (IVV) ($250K–$500K).
The report lists no debts that we count, so the range of $4.2 million to $9.3 million comes from the assets alone, with a midpoint of about $6.7 million.
How the range has changed
Using the same method for every year, the midpoint of his disclosed range went from about $6.8 million on his 2015 report to about $6.7 million on his 2025 report. The highest midpoint was about $9.5 million, on the 2018 report. The lowest was about $4.4 million, in 2022. The chart shows ten reports from 2015 to 2025, each added up the same way, and nothing is filled in between them.
These are ranges built from the value bands on each form, not exact values. They move with market prices, property values, new or paid-off debts and the bands a filer picks, and the forms do not say which of these caused a change. Like every member of Congress, Dunn does not have to report a home he lives in, cars and personal belongings, or federal retirement savings such as the Thrift Savings Plan, so his real net worth could be higher than these forms show.
Career and money timeline
- 2015
Earliest report in the House's online database: range of $2.6 million to $10.9 million (midpoint $6.8 million).
- 2017
Takes office in the U.S. House.
- 2018
Highest midpoint in the online reports: $9.5 million (range $4.9 million to $14.2 million).
- 2025
Latest report: range of $4.2 million to $9.3 million (midpoint $6.7 million).
- 2026
Announces he will not seek reelection.
Neal Dunn net worth FAQ
What is Neal Dunn's net worth?
Neal Dunn's 2025 financial disclosure puts household assets minus debts at $4.15M to $9.34M, a midpoint of about $6.74M. Officials report values in ranges, so this is an estimate, not an exact figure.
Where does this number come from?
From Neal Dunn's official annual financial disclosure, filed with the Clerk of the House on August 13, 2026. We add up every asset and debt band on the form. The same method is used for every year on the chart.
Has Neal Dunn's net worth changed since taking office?
Compared with the candidate report, the low end of the range went from $2.62M to $4.15M and the high end from $10.9M to $9.34M.
What are Neal Dunn's largest assets?
On his 2025 report, the largest holdings are IRA #3: Invesco QQQ Trust, Series 1 (QQQ) ($500K–$1M); IRA #3: Apple Inc. – Common Stock (AAPL) ($250K–$500K); IRA #3: iShares Core S&P 500 ETF (IVV) ($250K–$500K). Values are reported in bands, not exact amounts.
Sources
- Clerk of the U.S. House, Financial Disclosure Reports database (accessed November 8, 2026). Filings used for the chart:
- 2025 annual report (August 13, 2026)
- 2024 annual report (August 13, 2025)
- Amendment to 2023 annual report (August 13, 2026)
- 2022 annual report (August 13, 2023)
- 2021 annual report (August 13, 2022)
- 2020 annual report (August 12, 2021)
- 2019 annual report (August 13, 2020)
- 2018 annual report (August 12, 2019)
- 2016 report (new member) (May 15, 2017)
- Candidate report (November 23, 2015)
- House Committee on Ethics, Financial Disclosure Instruction Guide (calendar year 2025). What is and isn’t reported.
- Background facts: Wikipedia, Neal Dunn (accessed November 8, 2026). Used for career facts only, never for figures.
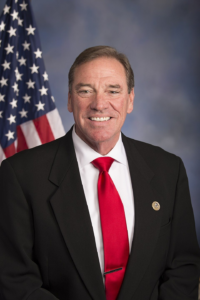
Photo: United States Congress/U.S. House Office of Photography, Public domain, via Wikimedia Commons.
Every number on this page comes from an official filing or the named report next to it. We never fill in years with our own guesses, and this page is not a judgment about how the money was made. How we handle estimates.